LSA SwimTeam Pro utilizes time standards files which provide for any number of levels of times and any number of age groups. The CD Rom contains the following time standards:
| TimesABC.mdb | USS Top-16 based (AA, A, B,…) times |
| TimesQuad.mdb | USS Quadrennium time standards |
| TimesChamp.mdb | USS Championship based time standards |
You can use these time standards files to label swimmer's best times and to compute a distribution of swimmers' times in your club.
Installing the Time Standards
The time standards are found on your CD-ROM and can also be downloaded from the LSA Web site. Create a convenient folder for them, such as \swim4\TimeStds and copy the three files into the folder.
Printing out Best Times
Select Printer | Reports | Print swimmers times. This brings up a list of squads.

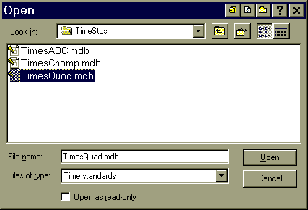
Click on the button labeled Time Standards… to select one of the tables to use:

Select one of the files and click on Open. Then click on one or more of the courses, select Show best times and click on Print. The swimmer's best times will be printed along with the category their times belong to.
Computing a Time Standard Distribution for Your Team
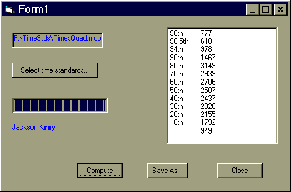
You can also use Team 6.0 Pro to calculate a distribution of your team's times against any time standards file. You can then save this distribution in a file, paste it into a graphics program, or a spreadsheet program with graphics capabilities and plot the results. To use this feature, select Print | Reports | Time standard distribution. Then click on the Select time standards… button, select a time standrad as above, and then click on Compute. Depending on the size of your team and the number of meets you have stored, this calculation can take 15 to 30 minutes. When the computation is completed, you will see a list of categories and the number of swims in each category in the list box. To save these in a file, click on Save as… and save the file under any name you choose.

The time standards are each computed based on the swimmer's age on the day of each meet, not on the swimmer's age on the day of the computation.
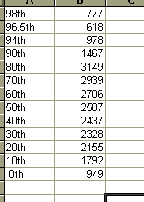
To plot these data, start Excel, open the data file you just saved in WordPad. Select all the times and then paste them into two columns in Excel.

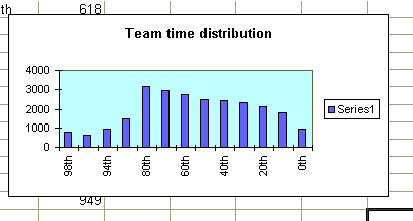
Finally, select both columns and select the Chart tool to plot a bar chart of these data as shown below:
